
Wind Field Viewer
The Wind Field viewer lets you load and inspect any TurbSim binary wind field (.bts) file — examining mean wind speed profiles, turbulence structure, and spatial coherence across the rotor disk. Click Wind Field under INSPECT in the sidebar to open it.
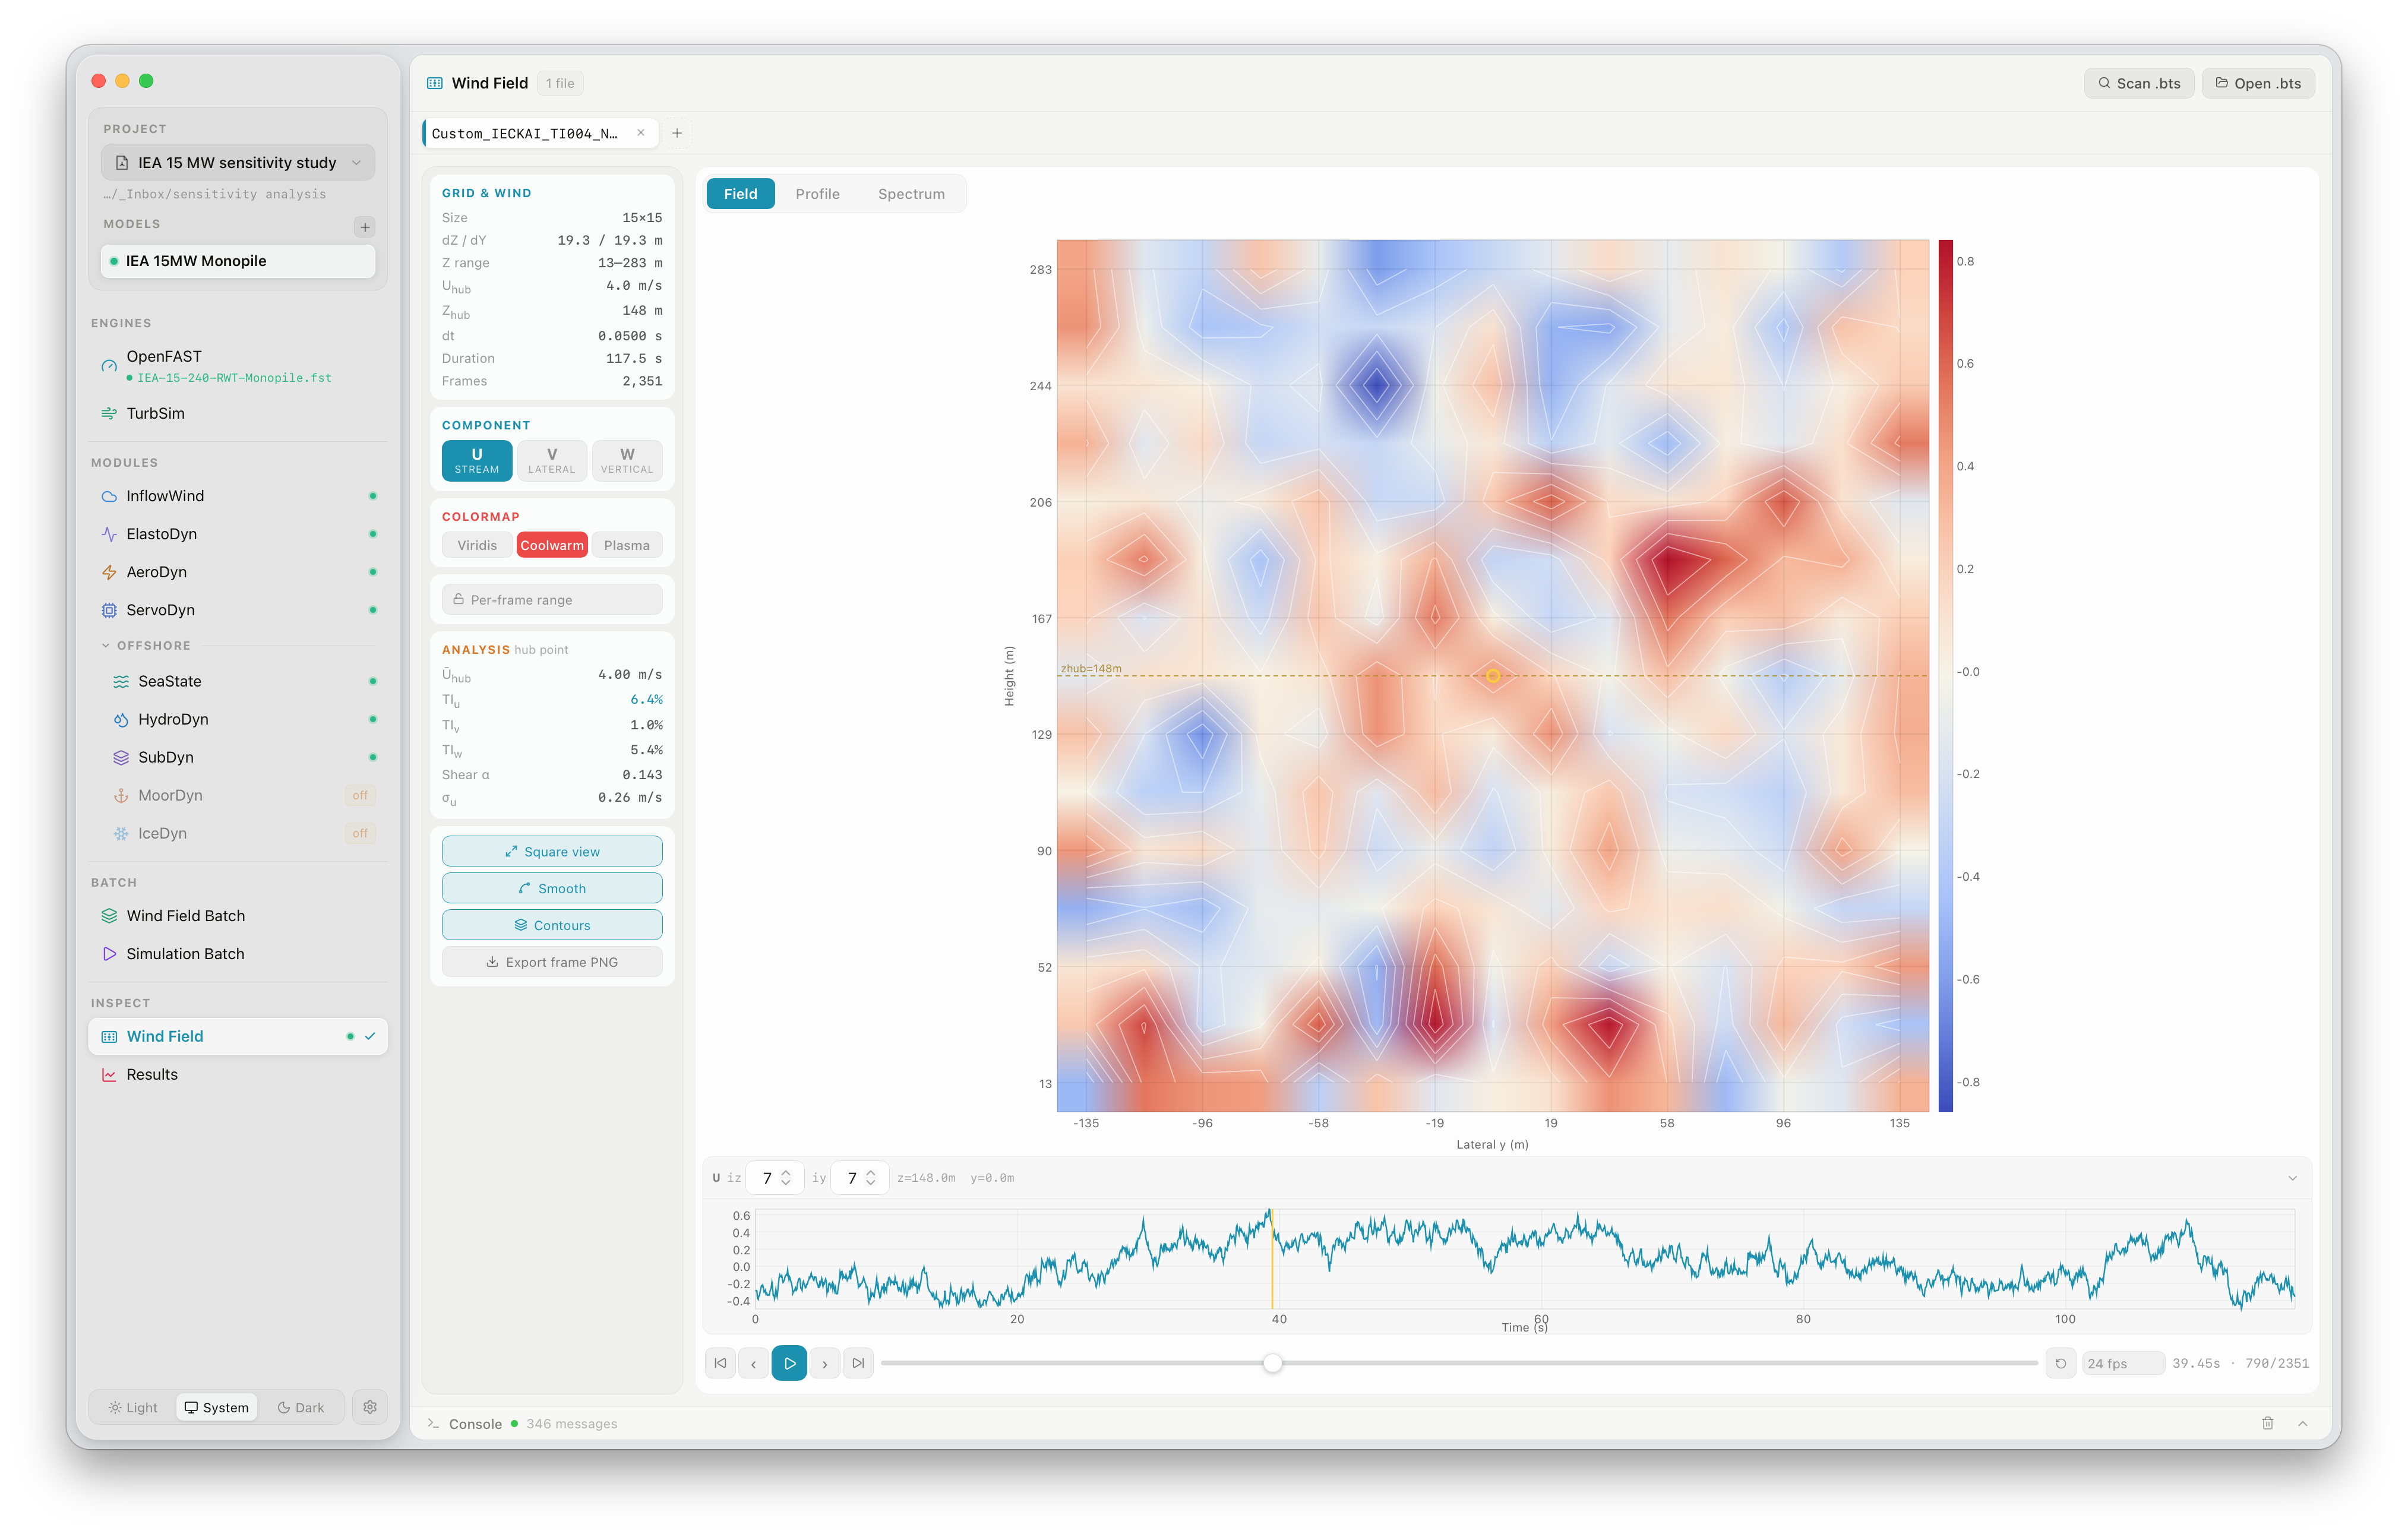
The viewer has three tabs — Field, Profile, and Spectrum — each providing a different view of the wind field data. The left panel shows grid metadata and per-frame analysis statistics.
Loading a wind field
Section titled “Loading a wind field”Click Open .bts to browse to any .bts file on your file system, or drag a file directly onto the panel. FlowUrja Studio reads the binary header to extract the grid dimensions, hub height, mean wind speed, and simulation metadata before rendering.
Wind fields generated in the current project are also accessible directly — the most recently generated file is loaded automatically when you open the viewer.
What is shown
Section titled “What is shown”Wind field cross-section
Section titled “Wind field cross-section”The main view renders a horizontal cross-section of the along-wind (u-component) velocity field at hub height, plotted across the lateral (Y) and time axes. Turbulence structures — gusts, coherent eddies — are visible as bands of higher and lower wind speed moving across the rotor plane.
The colour scale maps wind speed relative to the mean using the selected colourmap (Coolwarm by default): blue for below-mean and red for above-mean velocities. Three colourmaps are available — Viridis, Coolwarm, and Plasma — switchable from the left panel.
Profile plot
Section titled “Profile plot”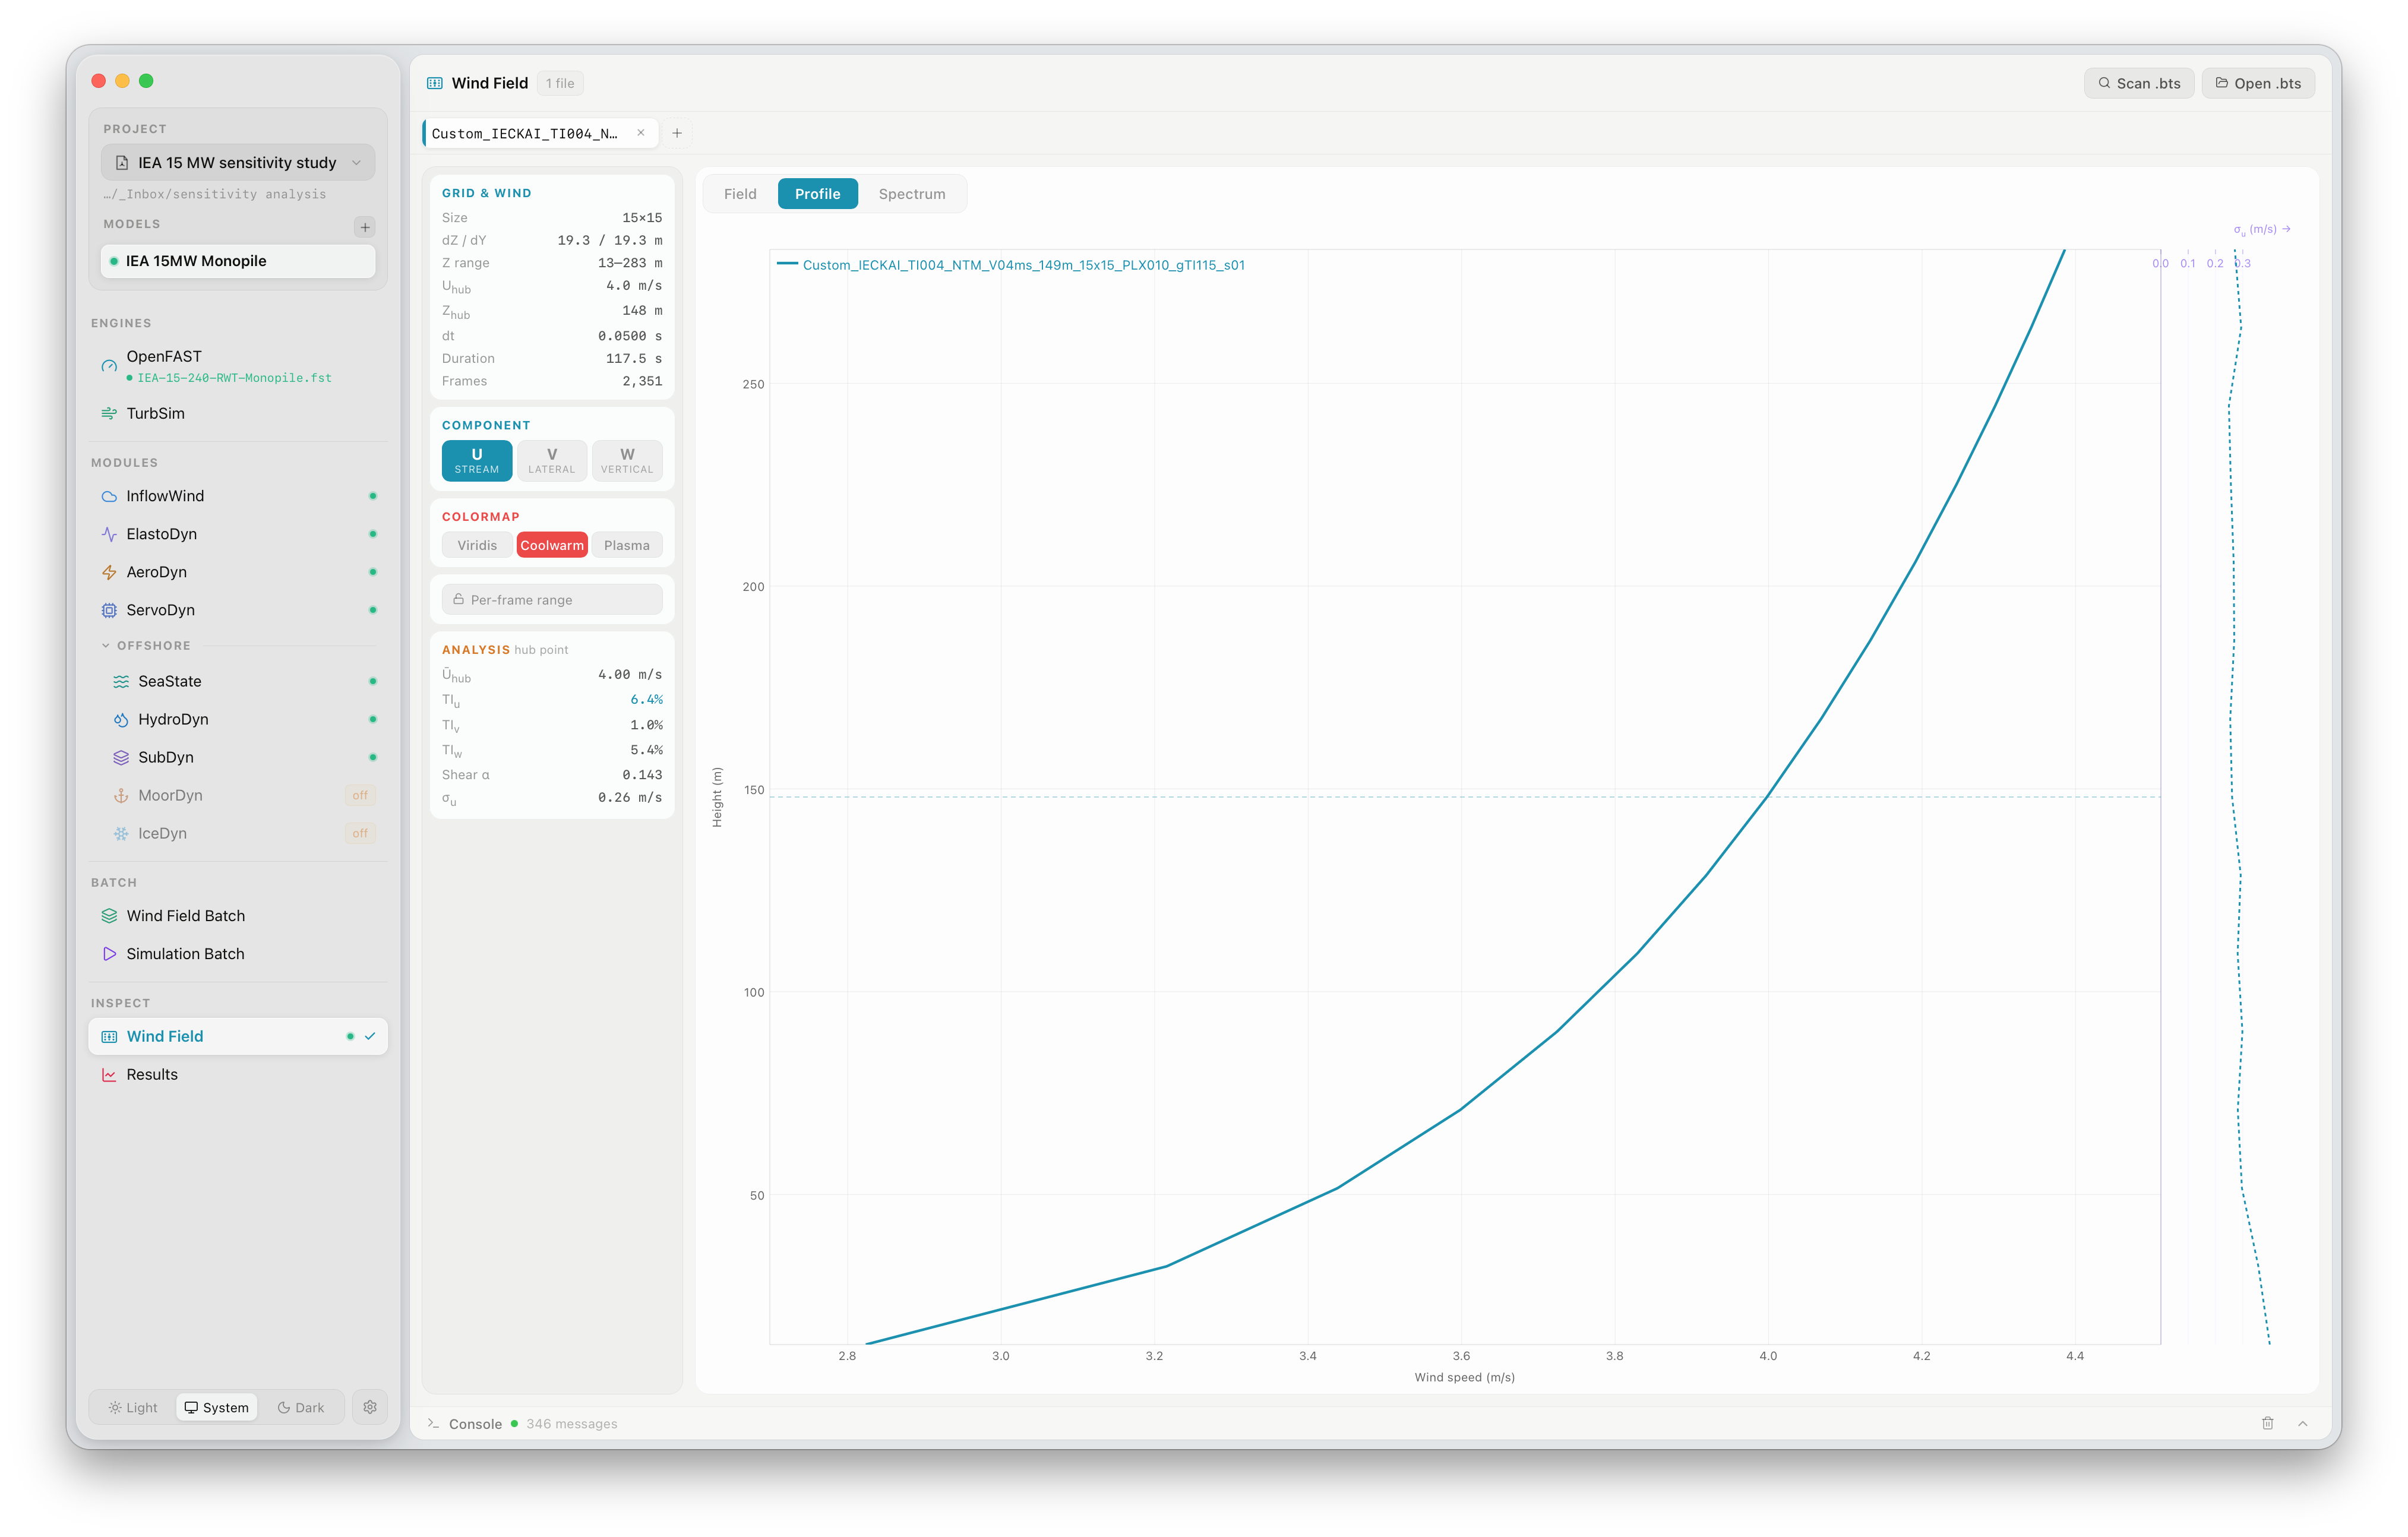
The profile panel shows vertical profiles of:
| Profile | Description |
|---|---|
| Mean wind speed | Spatially averaged U(z) across all lateral grid points — confirms the power-law shear is applied correctly |
| Turbulence intensity | Standard deviation of u divided by mean U, plotted vs height — for gTI > 1.0, this should show a clear decreasing trend from bottom to top |
| σ_u profile | Raw along-wind standard deviation vs height |
These profiles are computed from the full time series at each grid point, not from the TurbSim summary file, giving an independent verification of the actual statistics in the .bts file.
Grid coordinates
Section titled “Grid coordinates”Hovering over any point in the cross-section view shows:
- Grid indices (k, j) in the Z × Y grid
- Physical coordinates (z, y) in metres relative to hub centre
- Instantaneous wind speed at that point and time
This is useful for checking that the grid physically covers the rotor swept area and confirming hub height alignment.
Key metadata
Section titled “Key metadata”The left panel shows two information blocks:
Grid & Wind — parameters extracted from the .bts file header:
| Item | Description |
|---|---|
| Size | Grid resolution (NZ × NY grid points, e.g. 15×15) |
| dZ / dY | Vertical and lateral grid spacing in metres |
| Z range | Minimum and maximum height of the grid in metres |
| U_hub | Hub-height mean wind speed in m/s |
| dt | Time step in seconds |
| Duration | Total wind field duration in seconds |
| Frames | Total number of time frames in the file |
Analysis — computed statistics at the hub point:
| Item | Description |
|---|---|
| U_hub | Realised hub-height mean wind speed |
| TI_u | Along-wind turbulence intensity at hub height |
| TI_b | Cross-wind turbulence intensity at hub height |
| TI_w | Vertical turbulence intensity at hub height |
| Shear α | Fitted power-law shear exponent from the mean profile |
| σ_u | Along-wind standard deviation at hub height in m/s |
Using the viewer for quality control
Section titled “Using the viewer for quality control”Before running a large simulation batch, it is good practice to visually inspect at least one wind field per turbulence condition:
- Check the mean profile — confirm U(z) follows the expected power-law slope for the configured shear exponent.
- Check the TI profile — for gTI > 1.0 runs, confirm that σ_u is higher at the bottom of the rotor than at the top and that the ratio approximates the target gTI value.
- Check for artefacts — occasional TurbSim runs produce spurious spikes or flat regions. These are visible in the cross-section as vertical stripes with anomalous colour.
Supported file format
Section titled “Supported file format”FlowUrja Studio reads the TurbSim FF Binary format (.bts), which is the native output of TurbSim v2.0 and later and the format required by OpenFAST’s InflowWind module with WindType = 3. Files generated by earlier versions of TurbSim or by other tools (e.g. Mann turbulence generator) are not currently supported.